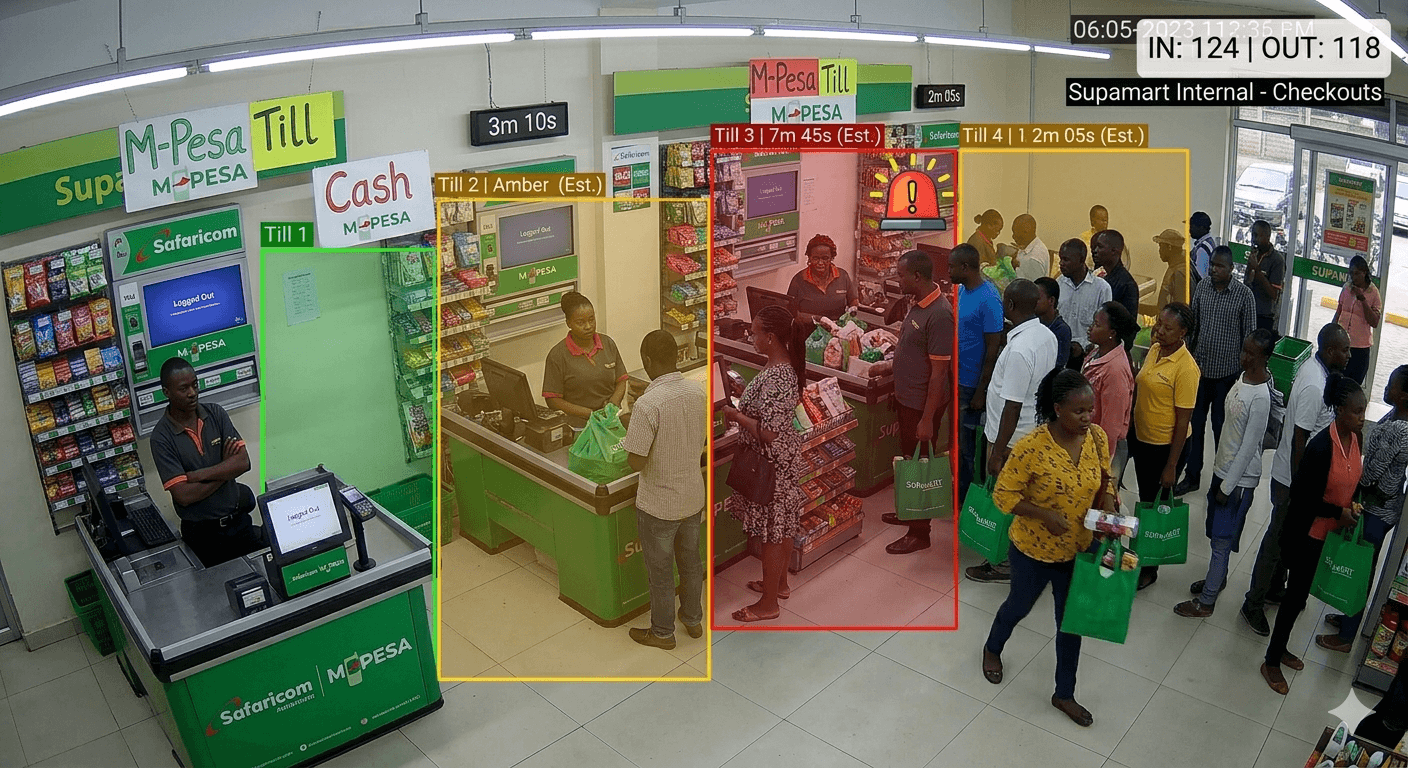
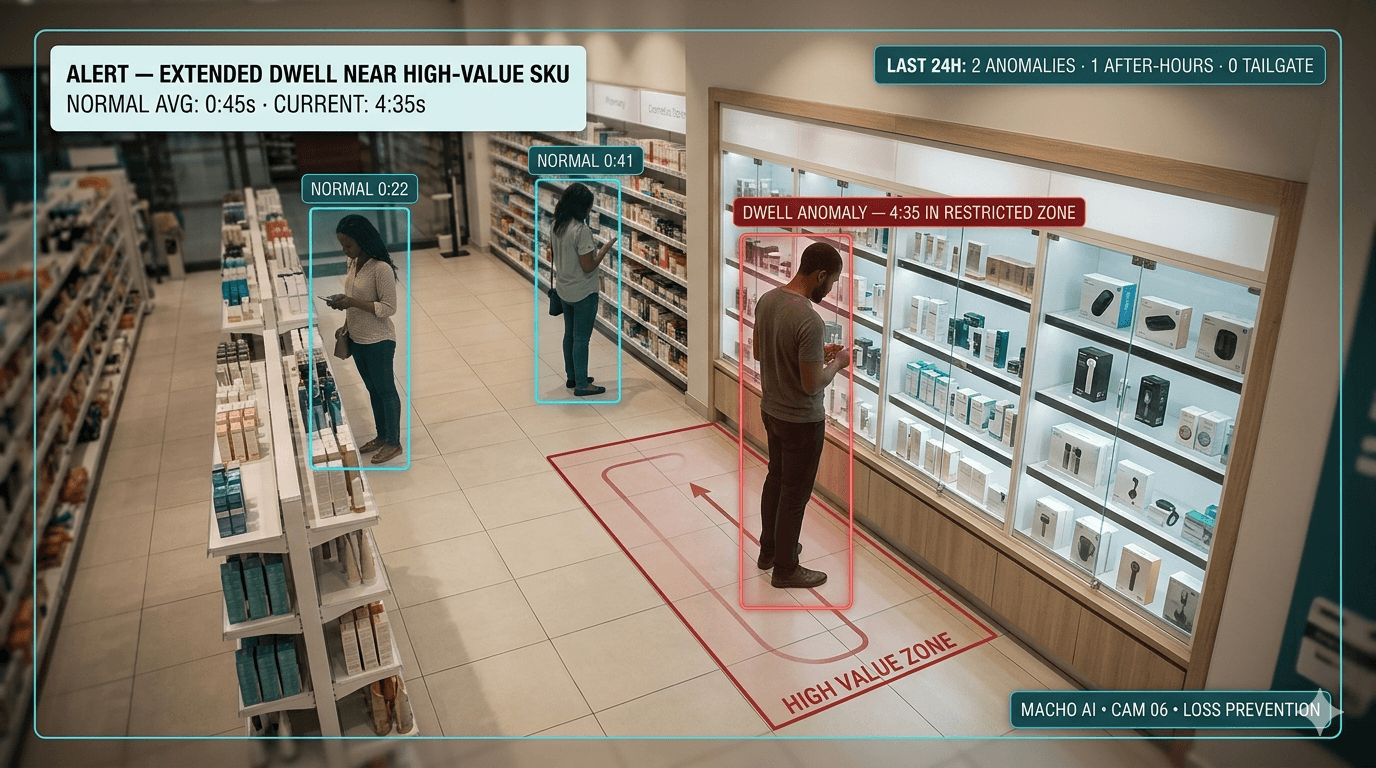
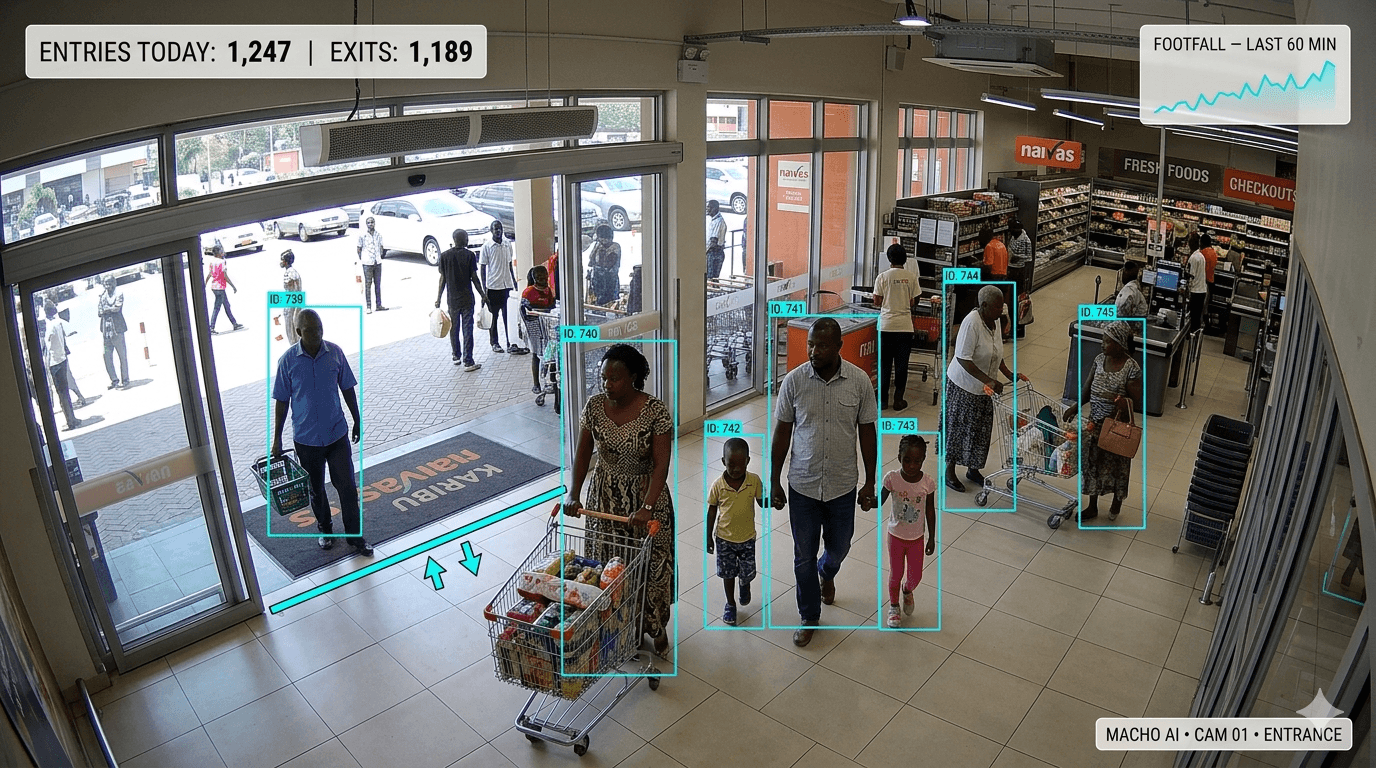
Showcasing at RETRAK Retail Summit · 14–15 May 2026

Your cameras already see everything.
We turn what they see into action.

Macho AI reads the feed from your existing CCTV and produces one thing every retail manager needs: the next decision. Open a till. Rotate an endcap. Review an anomaly. Redeploy a cashier.

1.49M
events analysed
6
camera viewpoints
5
manager views
48h
to live insights
Total Visitors
12,847
+12.5%
Active Now
284
+8.2%
Avg Dwell
4.2m
+2.1%
Queue alert
5+ min wait
Action needed at Pump 3
Camera Visualization Kit

One camera. One job. Four KPIs.

Six hero viewpoints. Each one answers a specific question a retail manager asks every day and gives them the number to act on.

Entrance doorway dashboard preview
Camera 01

Entrance / Doorway

The highest-value viewpoint for counting visitors, peak windows, and in/out flow from existing CCTV.

  • Unique visitors
  • Hourly footfall
  • In/Out split
  • Tailgating
Pays for itself in 30 days via labour rosteringPowers View 1 — Storefront
Checkout queue dashboard preview
Camera 02

Checkout / Queue

Tracks queue pressure before the line turns into lost sales and customer frustration.

  • Queue length/till
  • Wait time
  • Abandonments
  • Till utilisation
17+ abandonments recovered per dayPowers View 2 — Checkout
Shopping aisle and queue analytics dashboard preview
Camera 03

Aisle / Zone Analytics

Turns category movement into dwell insights, hot zones, and cold-spot alerts.

  • Dwell per zone
  • Zone ranking
  • Cold spots
  • Motion paths
Cold aisles become a weekly feedback loopPowers View 3 — Zone & Dwell
Promo display analytics dashboard preview
Camera 04

Endcap / Promo Display

Measures engagement at promotional islands so merchandising decisions stop being guesswork.

  • Passerby vs engaged
  • Engagement rate
  • Avg dwell
  • WoW delta
A/B-tested endcaps, budget follows resultsPowers View 3 — Zone & Dwell
Parking lot analytics dashboard preview
Camera 05

Parking Lot

Elevated exterior view that spots overstays and capacity issues before shoppers are turned away.

  • Occupancy %
  • Avg duration
  • Overstays
  • Lot-to-store Δ
6 overstays/day recovered = ~14 shopper-hoursPowers View 4 — Parking
Loss prevention analytics dashboard preview
Camera 06

Loss Prevention

Surfaces only the anomalies worth a human review, so LP teams stay focused.

  • Dwell anomalies
  • After-hours events
  • Tailgating
  • Shrink-risk score
10-20% shrink reduction typicalPowers View 4 — Perimeter
Analytics

One dashboard. Five managers. Zero dashboards-as-homework.

Every view is action-first. Every panel ends with what do I do about this? Every decision is one click from the data that justifies it.

View 01

Storefront & Footfall

Store Manager

How many came in, when, and did we staff for it?

View 02

Checkout & Queue

Till Supervisor

Are we losing sales at the tills right now?

View 03

Zone & Dwell Analytics

Category Manager

Which shelves and displays are working, which aren’t?

View 04

Parking & Perimeter

Ops / Security

Is the lot healthy? Any perimeter issues?

View 05

Multi-Store Benchmark

Retail Executive

Which of my stores is a star, which is struggling?

Functionality

What the cameras do, the moment they go live.

Action-first building blocks designed to answer the four most urgent questions in every busy space.

People Counting

Measure true footfall with camera-only precision and track peak flow in minutes.

Queue Counting

Spot bottlenecks early and trigger staffing decisions before lines get long.

Live Occupancy Monitoring

Stay compliant, keep shoppers comfortable, and see real-time occupancy at a glance.

Vehicle Counting

Track lot activity and dwell so parking efficiency is never a guess.

Industries

The same intelligence, tuned to every environment.

From retail to transport hubs, each deployment ships with the metrics that matter most to that space.

Retail analytics dashboard preview

Retail analytics

See live footfall, queue pressure, and zone performance in one real-time view.

Open dashboard
Petrol station analytics dashboard preview

Petrol station

Monitor pump activity and queue build-up with on-camera traffic insights.

Hotel analytics dashboard preview

Hotel

Track dwell by aisle and measure promotion lift without extra hardware.

Real estate analytics dashboard preview

Real Estate

Understand visitor flow across properties to optimize staffing and security.

See the action-oriented dashboard live.

Five role-based views, a persistent Today’s Actions ribbon, and live charts populated with anonymised retail activity.

Why Retailers Pay

Four ways one Macho AI branch pays for itself in its first month.

Camera-only. No POS integration required. No new hardware. No six-month procurement cycle.

KES 28K

Weekly labour saving

From closing the rostering gap on View 1 alone

17+

Abandonments recovered/day

Every queue alert acted on is revenue saved

41%

Cold-aisle visibility

Sustained low-dwell zones become actionable

10-20%

Shrink reduction

Only anomalies worth a human review

Built for African Operating Realities

Works on unreliable internet · Minimal data costs · Kenya DPA compliant · Local support